Engineering Risk

erei infographic

The Engineering Risk Exposure Index (EREI): Measuring What Dashboards Miss.

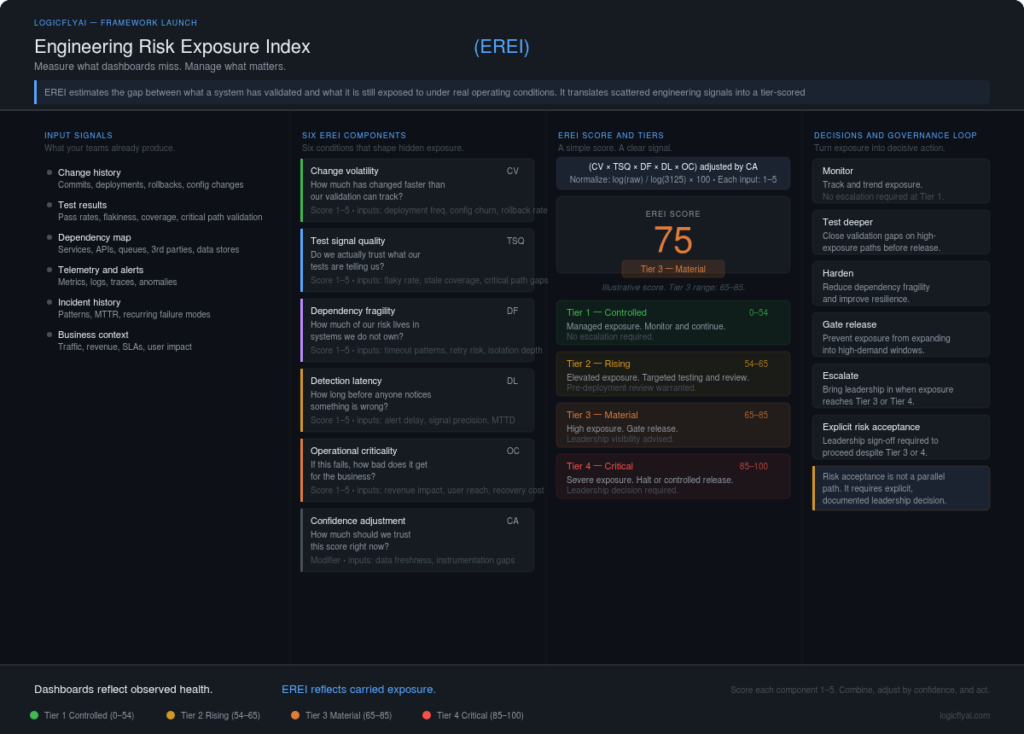
A large software platform enters a high-value demand window. Traffic climbs fast. Checkout volume rises. Shared services run hotter than usual. Test suites passed earlier in the day. Deployment telemetry looked normal. Error rates are still within tolerance. Then, under sustained load, three services degrade in sequence. Not because one obvious defect slipped through. Not […]

The Engineering Risk Exposure Index (EREI): Measuring What Dashboards Miss. Read More »
coverage to exposure gap

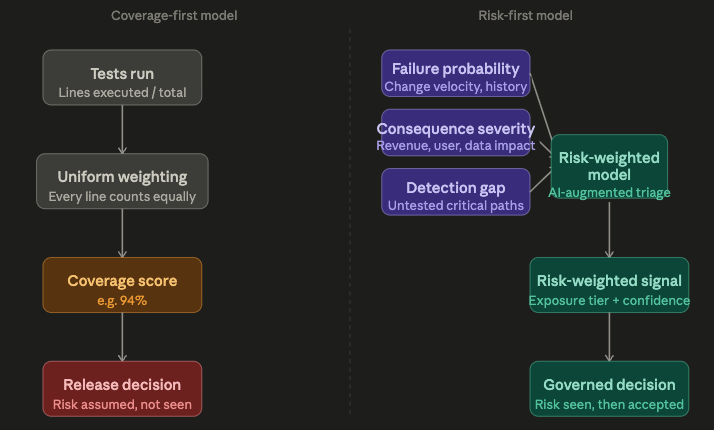
Green Dashboards, Hidden Exposure: Why Coverage Metrics Mislead

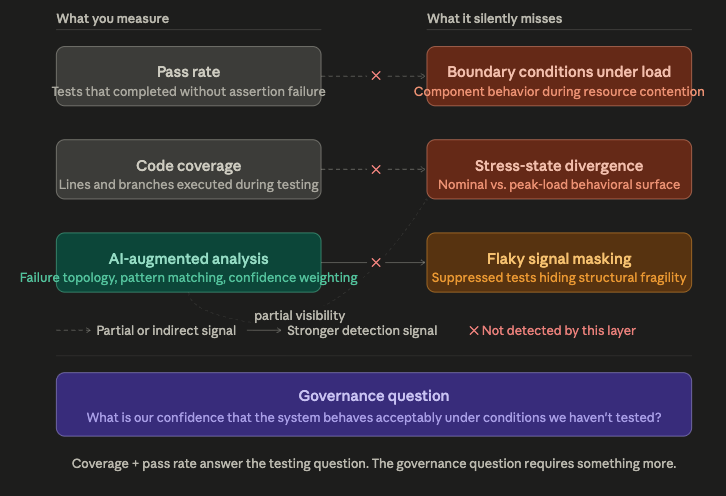
The dashboards looked clean. Ninety-four percent test pass rate. Eighty-one percent code coverage. Build pipelines green across every environment. The engineering org had spent months hardening its test suite, and the numbers reflected that effort. Leadership reviewed the metrics in quarterly planning and felt good about the trajectory. Then traffic spiked—a scheduled promotion, a regional

Green Dashboards, Hidden Exposure: Why Coverage Metrics Mislead Read More »

image 4 9 26 at 11.27 pm

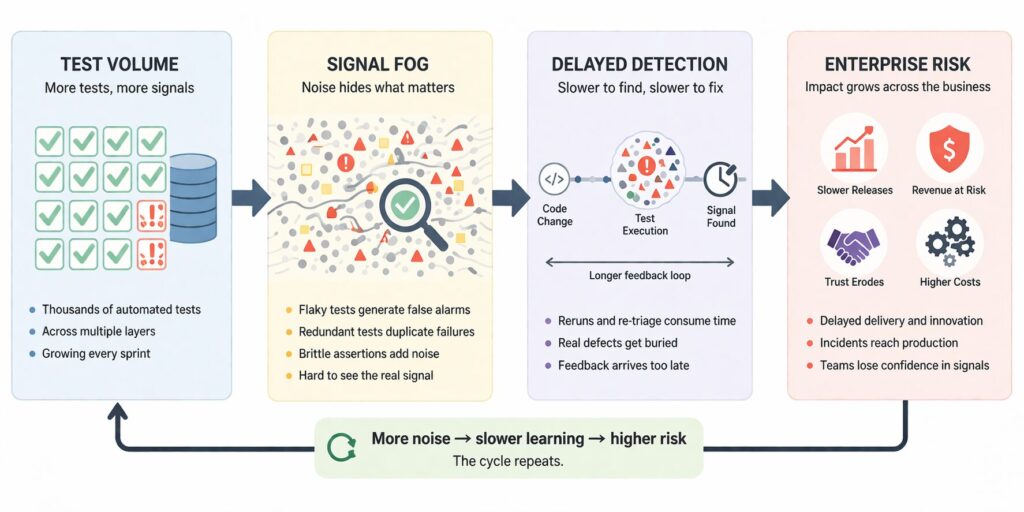
Test Automation Isn’t Broken—Your Risk Model Is

The dashboards looked fine. A SaaS-like platform. Thousands of tests. A CI pipeline that had been green for weeks. A coverage report sitting comfortably above ninety percent. The engineering team had invested seriously in automation—multiple test suites, staged environments, disciplined release gates. Then a high-traffic event hit. A checkout path that processed the heaviest transaction

Test Automation Isn’t Broken—Your Risk Model Is Read More »

image

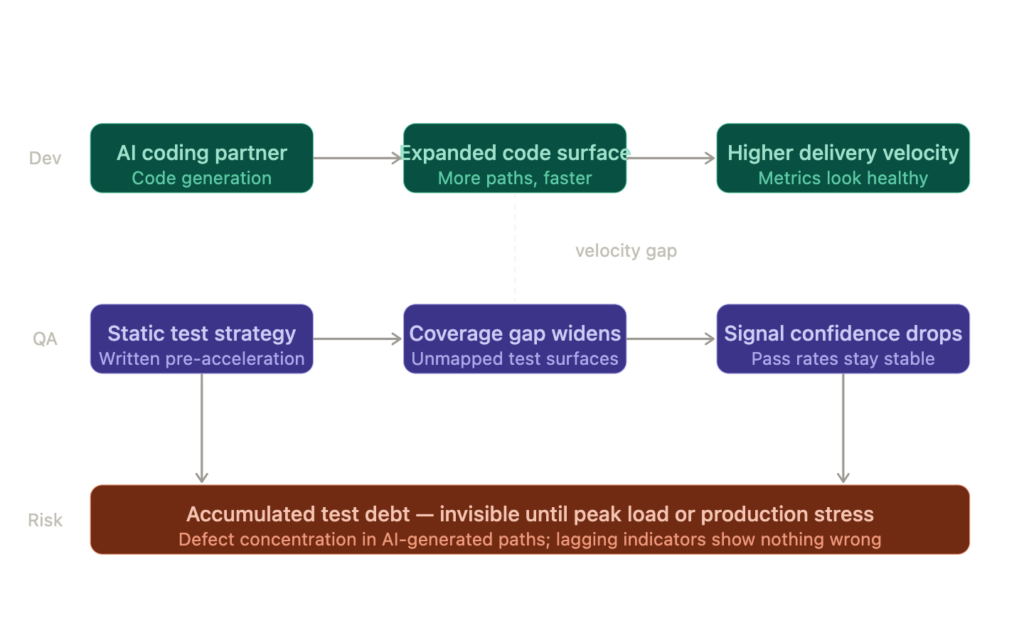
The Developer-QA AI Divide: When Coding Partners Outpace Test Strategy

The dashboards told a reassuring story. Velocity was up. Sprint completion rates had climbed steadily over the previous quarter. Defect escape rate — the team’s go-to health signal — remained flat. The engineering organization was producing more, faster, and the numbers confirmed it. Then a release hit peak traffic and broke in a way no

The Developer-QA AI Divide: When Coding Partners Outpace Test Strategy Read More »

0636fd8a6e2205443e68efa7037987b9608905ec69ee7a318ad1f8254af2fb7a

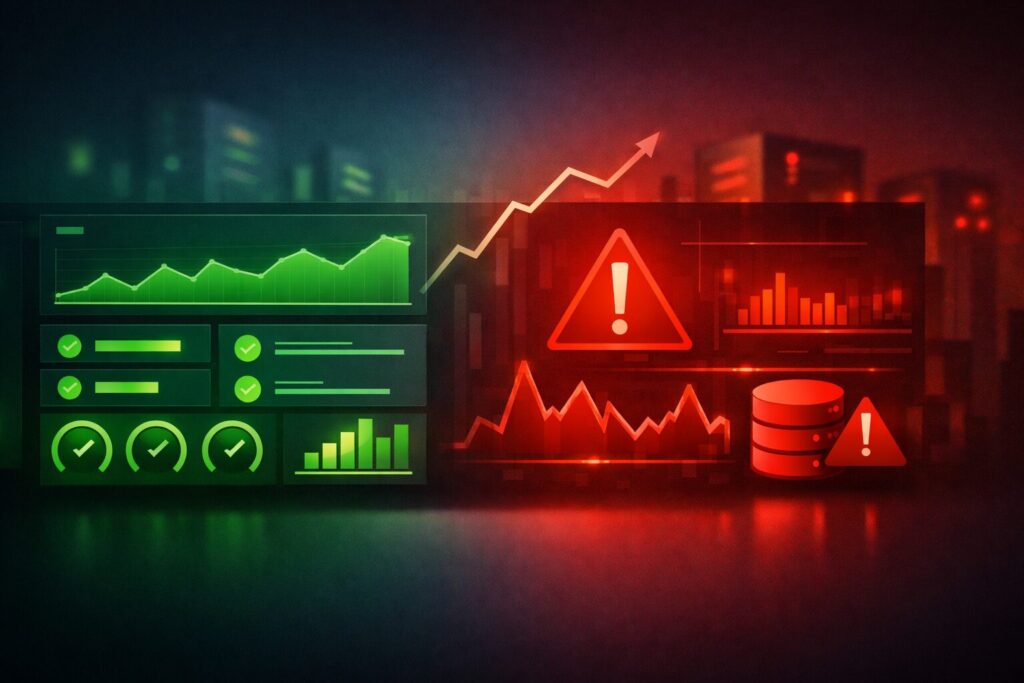
Dashboards were green. Customers still lost trust.

A peak window hits. The service status page is quiet. Uptime looks normal. Average latency is within the target band. Error rates are “acceptable.” Yet customers can’t complete a critical flow. Some get timeouts. Others see partial success. A few try again and make it through — which makes the problem harder to describe and

Dashboards were green. Customers still lost trust. Read More »

Scroll to Top