AI in Engineering

erei infographic

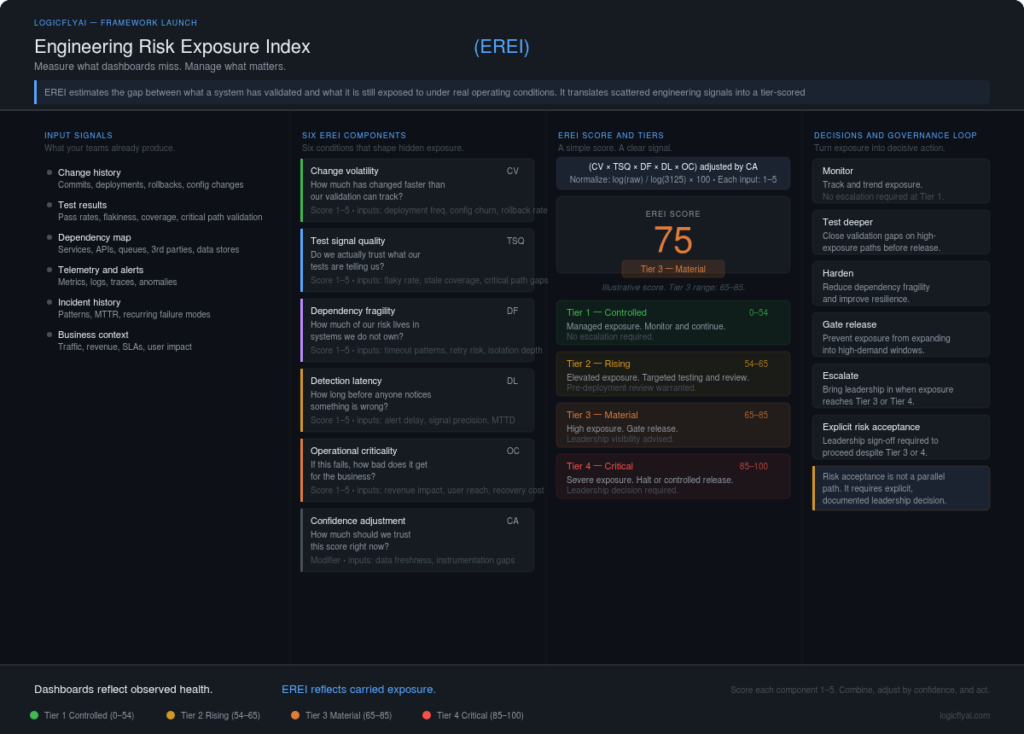
The Engineering Risk Exposure Index (EREI): Measuring What Dashboards Miss.

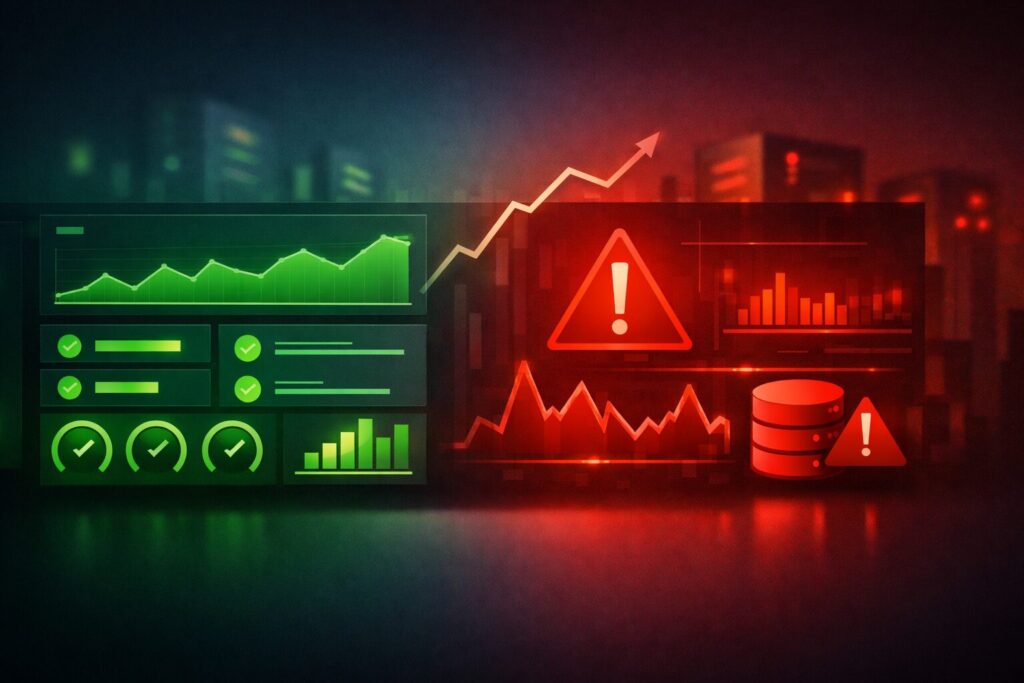
A large software platform enters a high-value demand window. Traffic climbs fast. Checkout volume rises. Shared services run hotter than usual. Test suites passed earlier in the day. Deployment telemetry looked normal. Error rates are still within tolerance. Then, under sustained load, three services degrade in sequence. Not because one obvious defect slipped through. Not […]

The Engineering Risk Exposure Index (EREI): Measuring What Dashboards Miss. Read More »
QA as Risk Intelligence: Reframing Quality Engineering’s Strategic Role

The system shipped clean. Every test suite passed. Code review was thorough, deployment ran without incident, and the monitoring dashboards stayed green through the first 48 hours post-release. Two weeks later, under a load spike that engineering had seen before—not an edge case, not an anomaly—three interconnected services began degrading in sequence. Response latency climbed.

QA as Risk Intelligence: Reframing Quality Engineering’s Strategic Role Read More »

979a4b613f24ad34f8517718d6da6291b2c64930c5d408ca974fcba20f6ee481

When validation agrees—but reality disagrees

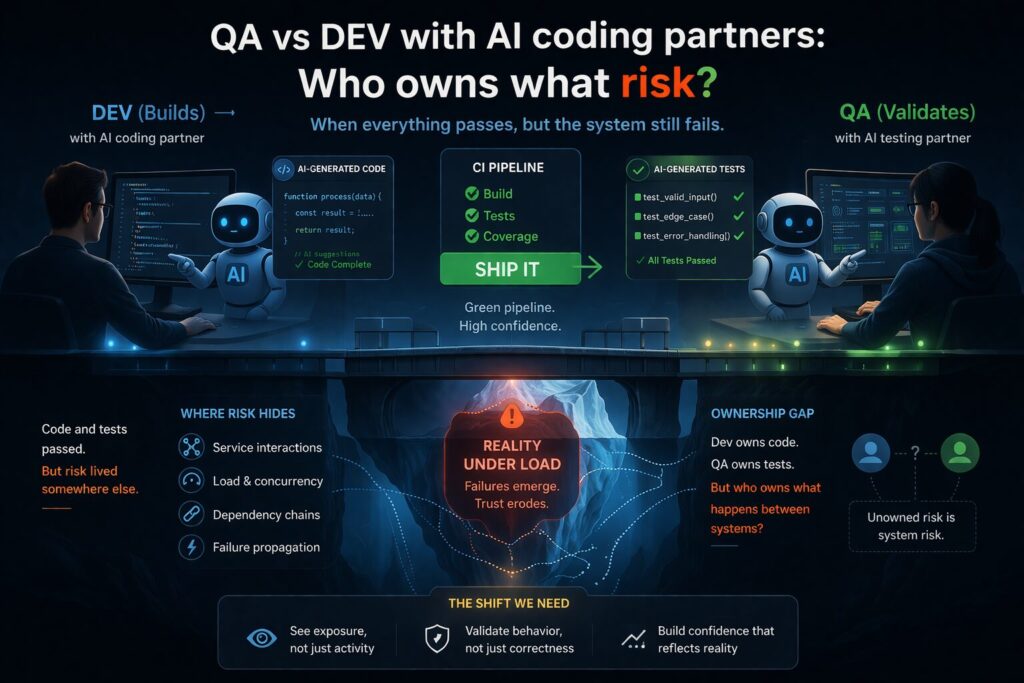
A feature is delivered faster than expected. An AI coding partner helped generate parts of the implementation. It also suggested unit tests. The pull request moved quickly—reviewed, approved, merged. CI pipelines were clean: Days later, under peak usage, the system begins to struggle. Latency increases. Retries accumulate. Downstream services degrade. Eventually, parts of the system

When validation agrees—but reality disagrees Read More »

0636fd8a6e2205443e68efa7037987b9608905ec69ee7a318ad1f8254af2fb7a

Dashboards were green. Customers still lost trust.

A peak window hits. The service status page is quiet. Uptime looks normal. Average latency is within the target band. Error rates are “acceptable.” Yet customers can’t complete a critical flow. Some get timeouts. Others see partial success. A few try again and make it through — which makes the problem harder to describe and

Dashboards were green. Customers still lost trust. Read More »

image 3 19 26 at 12.56 am

Why QA Teams Are Split on AI Adoption (And What That Reveals)

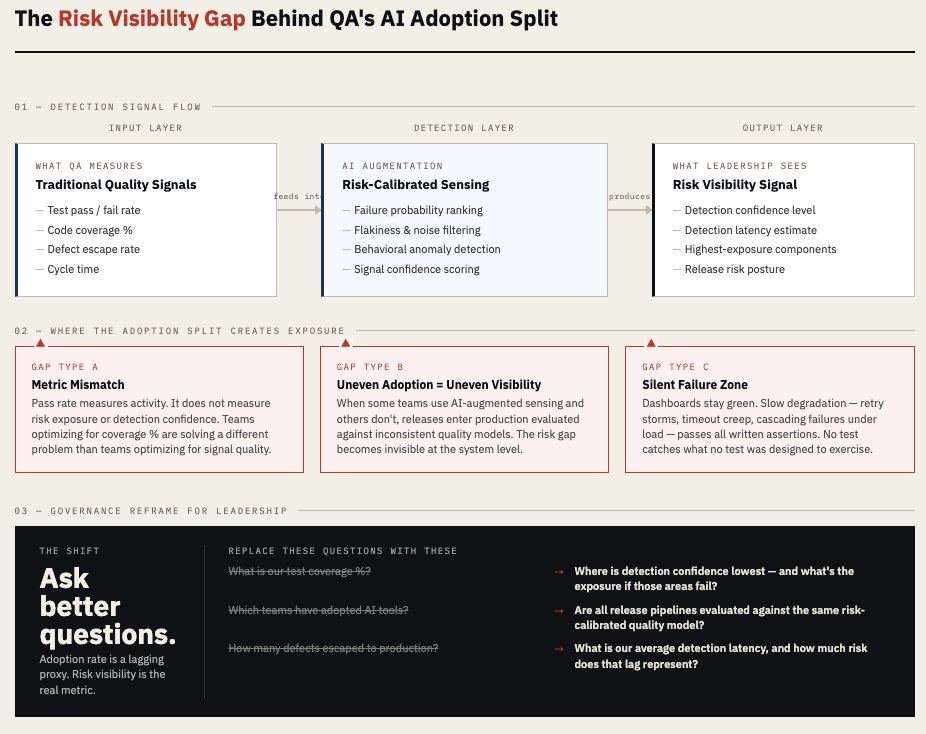
The dashboards showed 94% test pass rates. Coverage hovered above threshold. Velocity was stable. Then a large SaaS platform’s checkout flow degraded under peak traffic. Not a crash — a slow, compounding failure. Timeouts crept up. Retry storms followed. Revenue leaked quietly for four hours before anyone connected the dots. The QA team had run

Why QA Teams Are Split on AI Adoption (And What That Reveals) Read More »

Scroll to Top